Changelogs
The Changelogs module tracks and documents all changes made to your clients' infrastructure. Each company can have multiple changelogs organized by type, with detailed entries viewable in timeline, list, or calendar format.
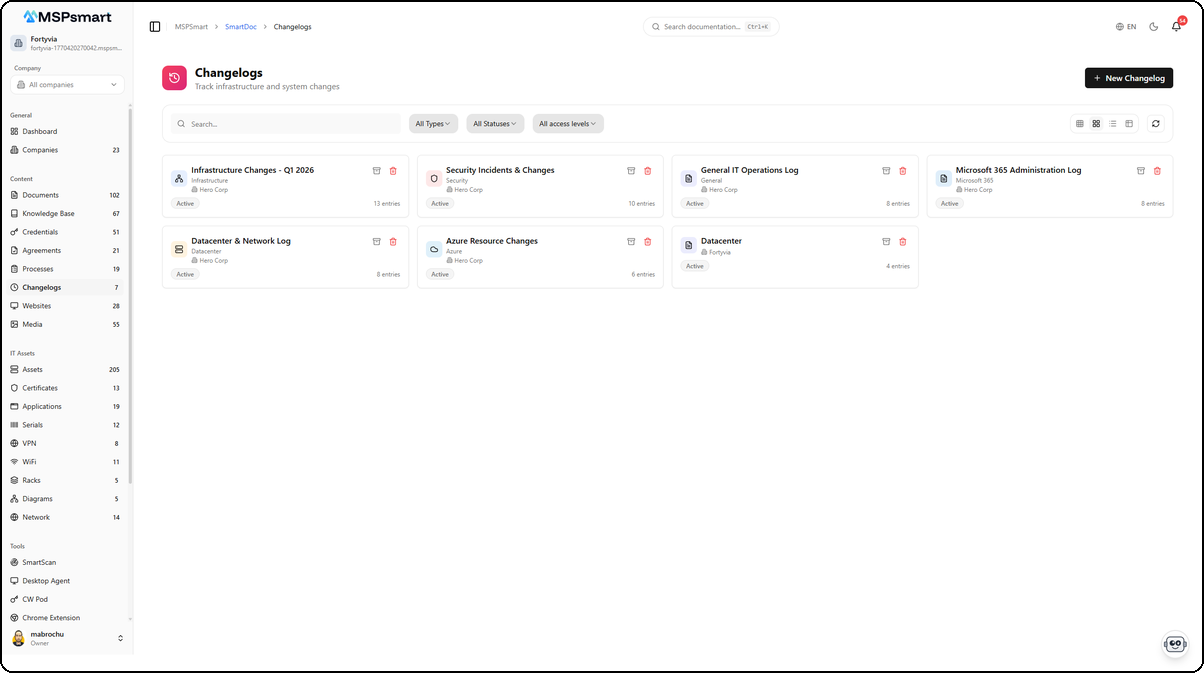
Changelog List
The main page displays all changelogs in a table with the following columns:
| Column | Description |
|---|---|
| Name | Changelog name with type icon |
| Type | Category (Infrastructure, Security, General, Microsoft 365, Datacenter, Azure) |
| Status | Active or archived status (green badge) |
| Entries | Total number of entries in the changelog |
| Last entry | Date of the most recent entry |
| Access | Access level (Internal, Client, Public) with dropdown |
| Actions | Archive and delete buttons |
Filters
- Real-time search by name and description
- All Types: filter by changelog type
- All Statuses: filter by status (Active / Archived)
- All access levels: filter by access level
Display Modes
Four display modes are available via icons at the top-right:
| Mode | Description |
|---|---|
| Grid (small cards) | Compact grid view |
| Grid (large cards) | Detailed grid view with description |
| List | List view with metadata |
| Table | Full table view with column sorting |
Create a Changelog
The + New Changelog button opens a creation form.
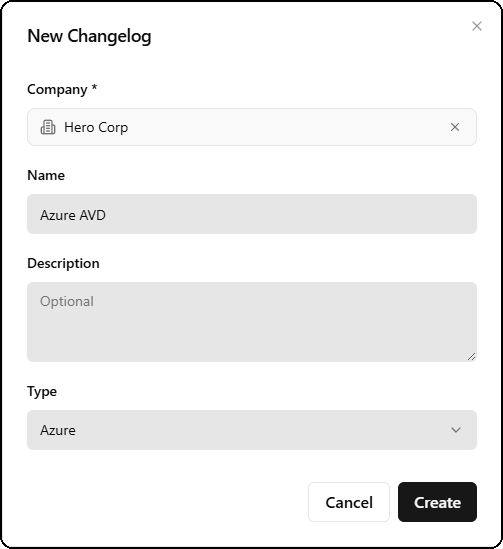
| Field | Required | Description |
|---|---|---|
| Company | Yes | Associated company (e.g., Hero Corp) |
| Name | No | Changelog name (e.g., Azure AVD) |
| Description | No | Optional description |
| Type | Yes | Changelog type (Azure, Datacenter, Infrastructure, Security, Microsoft 365, General) |
Changelog Types
SmartDoc includes 6 system types created automatically for every tenant:
| Type | Icon | Color | Usage |
|---|---|---|---|
| Azure | Cloud | Blue (#0078D4) | Microsoft Azure cloud infrastructure changes |
| Datacenter | Server | Green (#10b981) | Physical server and data center changes |
| Infrastructure | Network | Indigo (#6366f1) | Network and infrastructure changes |
| Security | Shield | Red (#ef4444) | Security updates and patches |
| Microsoft 365 | Orange (#D83B01) | Microsoft 365 and Office changes | |
| General | FileText | Gray (#71717a) | General changes and updates |
System types cannot be deleted. You can create custom types with name, description, Lucide icon, color, and sort order.
Entry Views
Clicking a changelog opens its entries with three visualization modes available via the Timeline, List, and Calendar tabs.
Timeline View
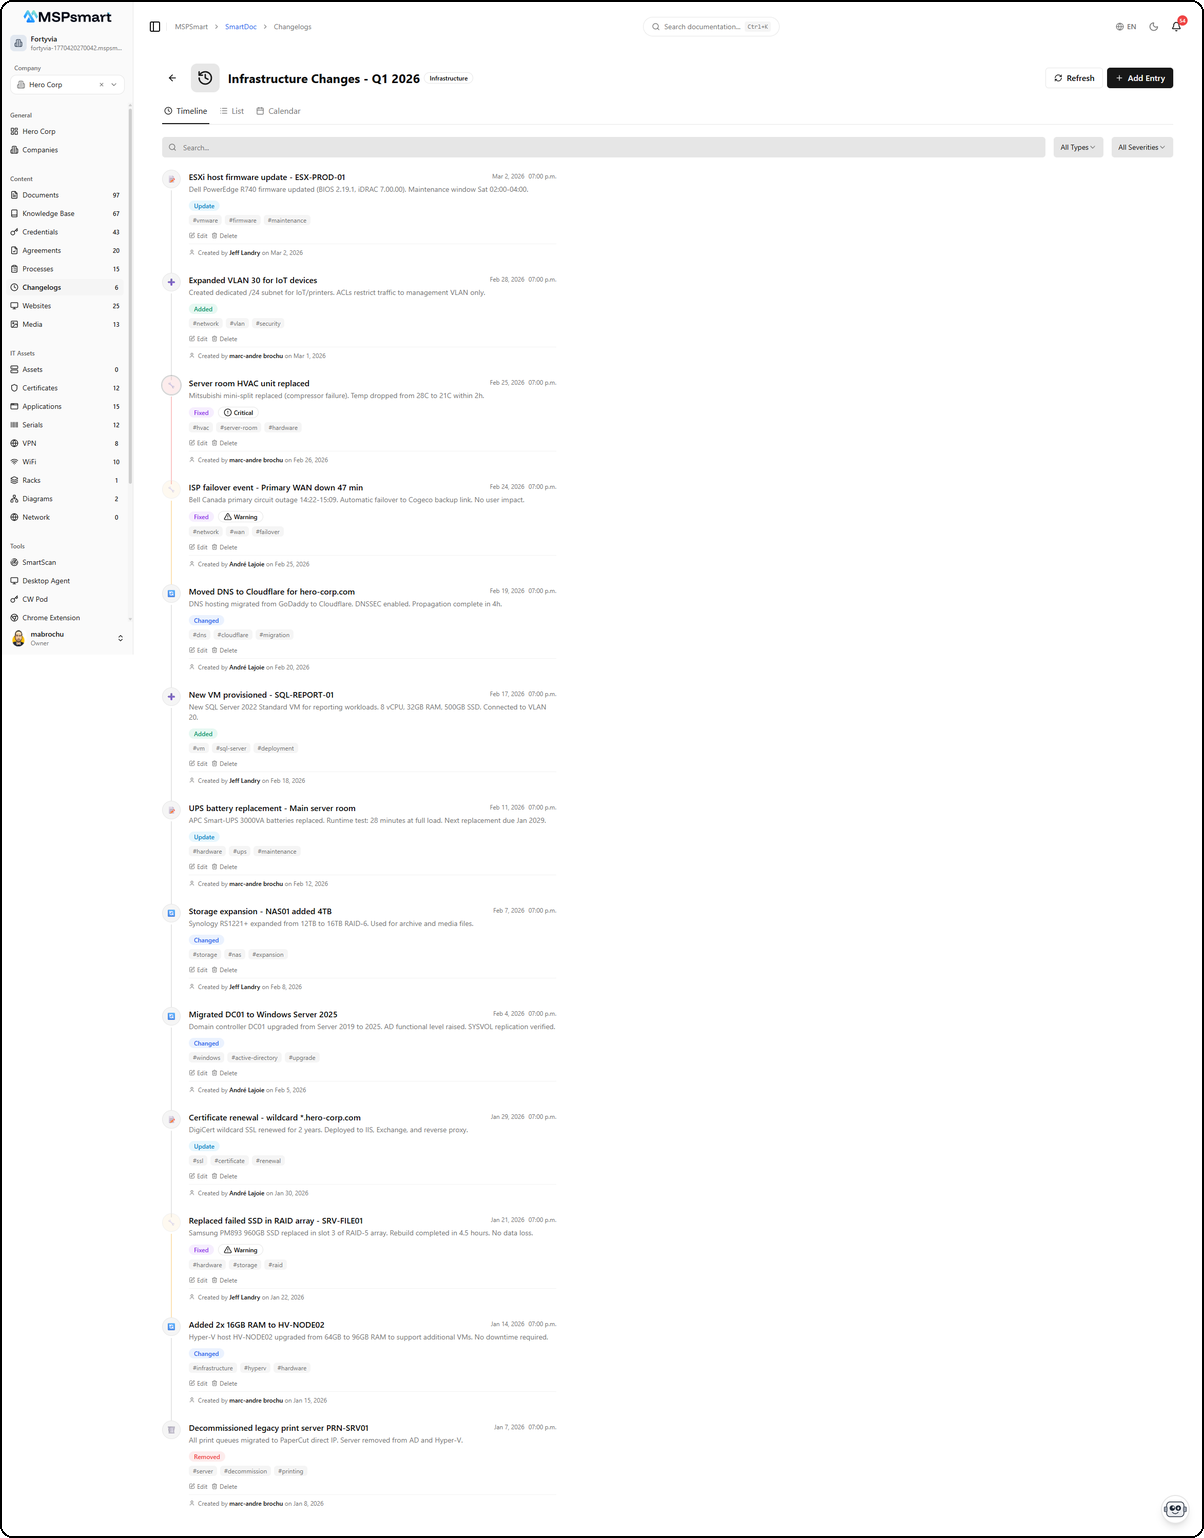
The timeline view displays entries in reverse chronological order. Each entry shows:
- Colored type icon on the left (Added in green, Changed in blue, Fixed in yellow, Removed in red, Update in purple, etc.)
- Title in bold with detailed description
- Date and time on the right
- Type badge colored (Added, Changed, Fixed, Removed, Update, etc.)
- Severity badge if applicable (Warning, Critical)
- Tags displayed as gray badges (e.g., #firmware, #network, #storage)
- Actions: Edit and Delete on each entry
- Author with avatar and creation date
The All Types and All Severities filters allow quick filtering. A search bar is also available.
List View
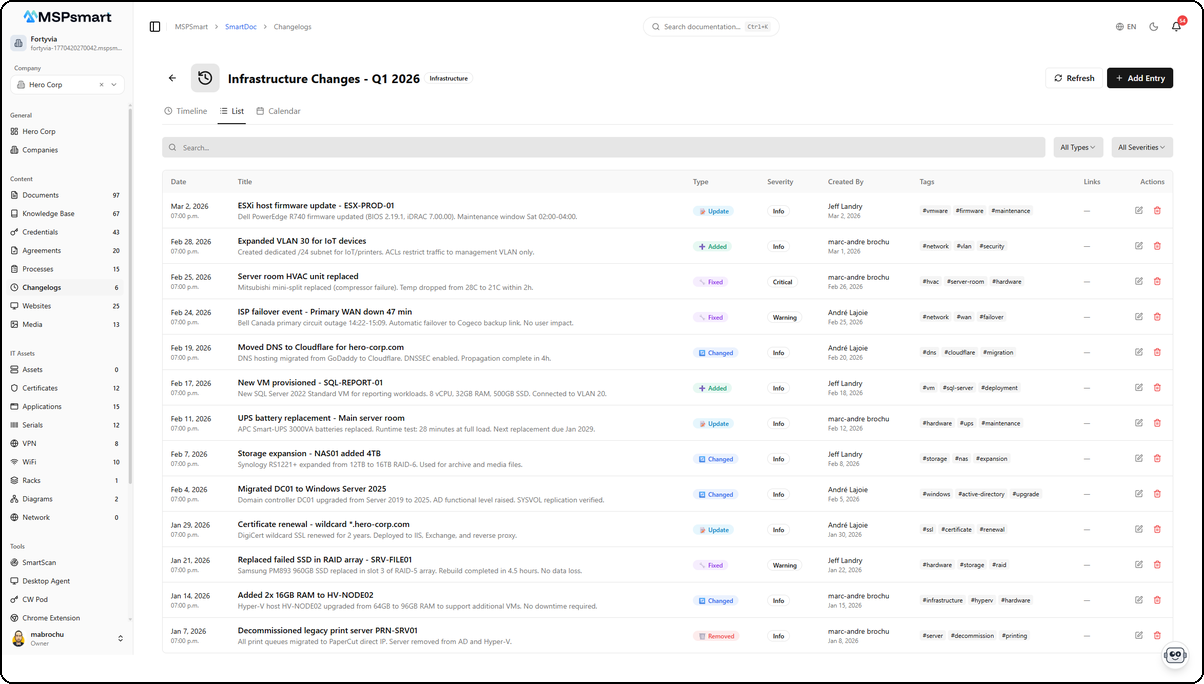
The list view displays entries in a detailed table with columns:
| Column | Description |
|---|---|
| Date | Date and time of the change |
| Title | Title and description of the change |
| Type | Colored badge (Update, Added, Changed, Fixed, Removed) |
| Severity | Severity level (Info, Warning, Critical) |
| Created By | Author with creation date |
| Tags | Tag badges (e.g., #firmware, #network, #ssl) |
| Links | Links to documents, assets, or KB articles |
| Actions | Edit and delete buttons |
The All Types and All Severities filters are available along with a search bar.
Calendar View
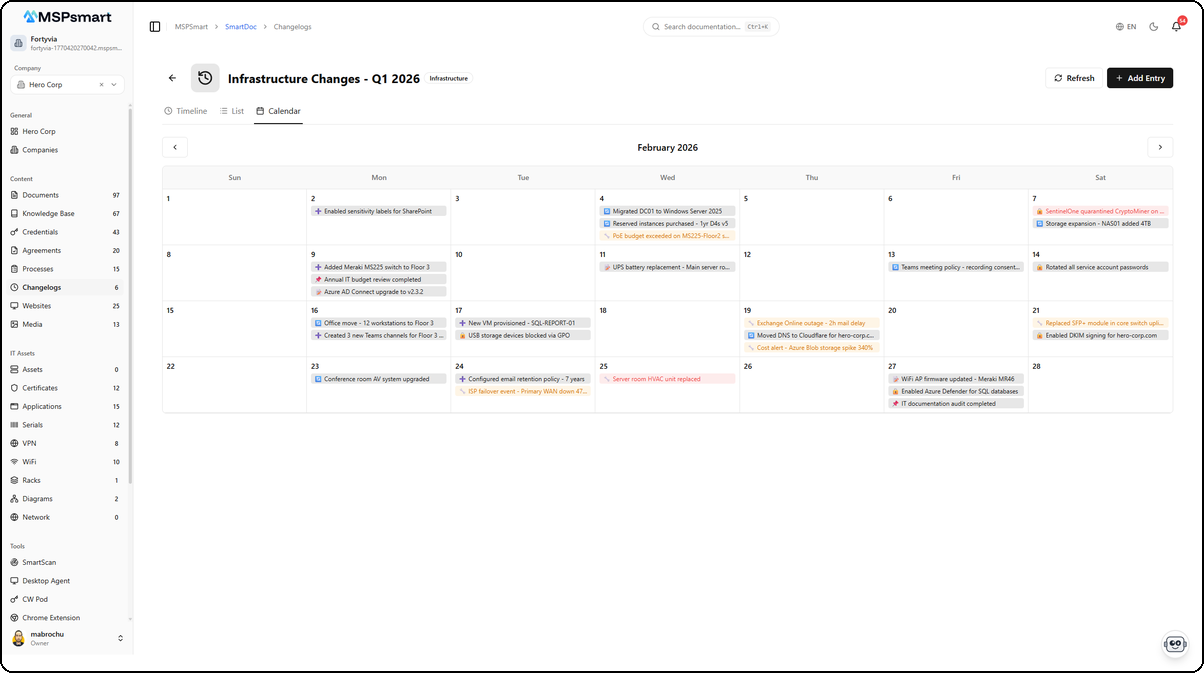
The calendar view displays entries in a monthly grid. Each day shows the changes made with:
- Type icon and change name
- Color coding by entry type (green for Added, blue for Changed, yellow for Fixed, red for Security, purple for Update)
- Navigation between months using left/right arrows
- Entries in red/orange indicate cost alerts or security incidents
The calendar view is ideal for visualizing change density and identifying periods of high activity on a client's infrastructure.
Create an Entry
The + Add Entry button in the changelog header opens a quick creation form.
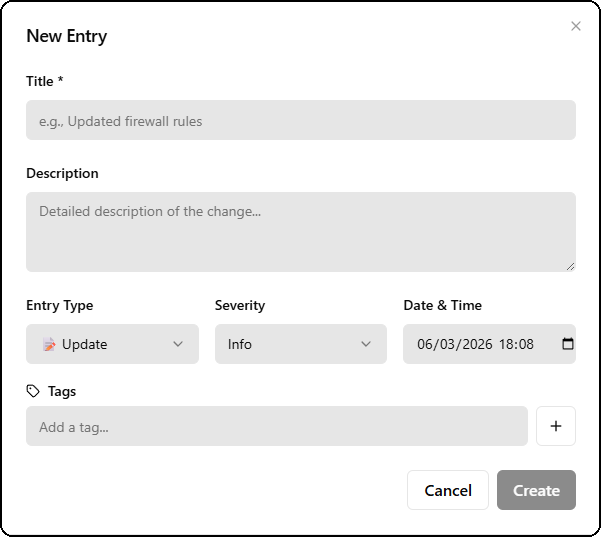
| Field | Required | Description |
|---|---|---|
| Title | Yes | Change title (e.g., "Updated firewall rules") |
| Description | No | Detailed description of the change |
| Entry Type | Yes | Entry type via dropdown (Update by default) |
| Severity | Yes | Severity via dropdown (Info by default) |
| Date & Time | Yes | Date and time of the change (pre-filled to now) |
| Tags | No | Free-form tags with input field and + button |
Edit an Entry
The edit page offers a complete form with all classification and linking options.
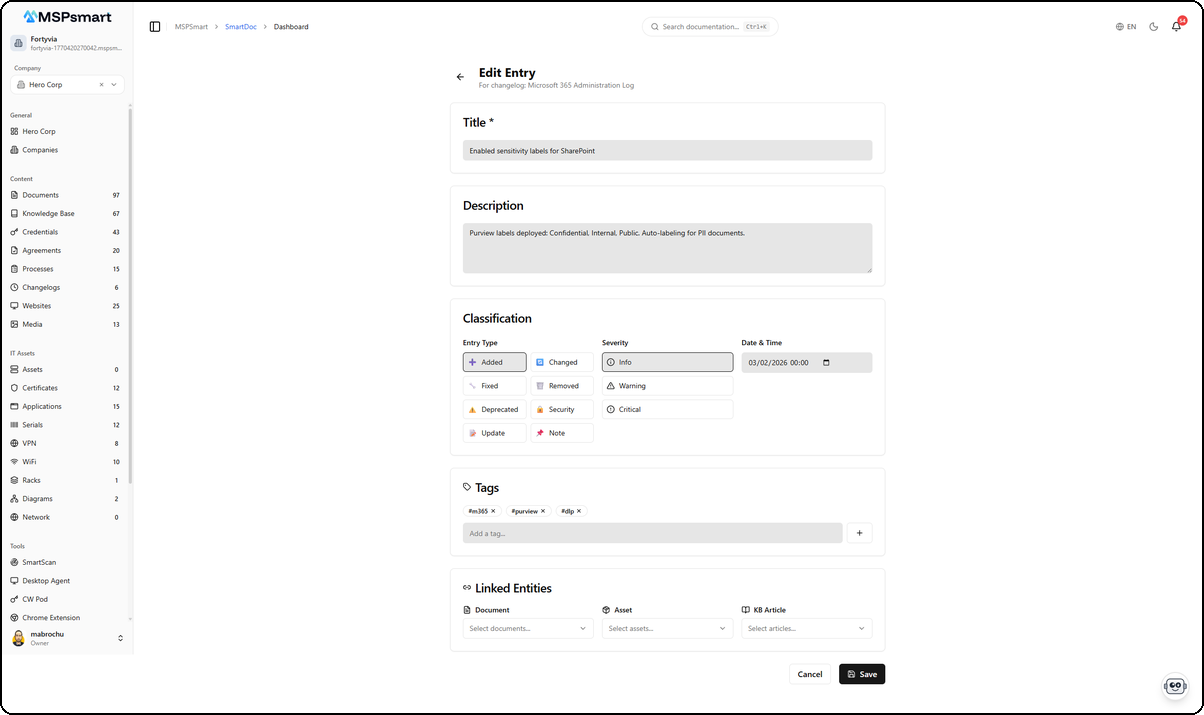
The edit form includes:
Classification
The Classification section displays entry types and severities as a grid of selectable buttons:
Entry Types:
| Type | Icon | Usage |
|---|---|---|
| Added | ➕ | New features, components, systems |
| Changed | 🔄 | Updated configurations, improvements |
| Fixed | 🔧 | Bug fixes, patches |
| Removed | 🗑️ | Retired services, deletions |
| Deprecated | ⚠️ | End-of-life warnings |
| Security | 🔒 | Security patches, vulnerabilities |
| Update | 📝 | General updates |
| Note | 📌 | Important information, reminders |
Severities:
| Severity | Icon | Usage |
|---|---|---|
| Info | ℹ️ | Informational updates |
| Warning | ⚠️ | Important but not critical |
| Critical | 🚨 | System outages, critical security |
Tags
Tags are displayed as badges with an × button to remove them (e.g., #m365, #purview, #dlp). The Add a tag... field with the + button allows adding new ones.
Linked Entities
The Linked Entities section lets you link the entry to existing SmartDoc items:
| Link | Description |
|---|---|
| Document | Link to a SmartDoc document via searchable dropdown |
| Asset | Link to an IT inventory asset |
| KB Article | Link to a knowledge base article |
Changelog Properties
| Property | Description |
|---|---|
| Name | Changelog name (bilingual) |
| Description | Optional description (bilingual) |
| Company | Associated client |
| Type | Category from defined types |
| Status | Active or Archived |
| Pinned | Displayed first in lists |
| Default | Default changelog for the company (one per company, used on the dashboard) |
| Access level | Internal, Client, or Public |
Search and Filters
Entries are filterable by multiple criteria:
- Full-text search — PostgreSQL
tsvectorindexing on title, content, and tags (weight: title > content > tags) - Entry type — Filter by any of the 8 types
- Severity — Info, Warning, Critical
- Date range — Start and end date
- Tags — Multi-tag filter via popover with search
- Configurable pagination
Access Levels
| Level | Admin Portal | Client Portal | Public |
|---|---|---|---|
| Internal | Yes | No | No |
| Client | Yes | Yes | No |
| Public | Yes | Yes | Yes |
Default Changelog
Each company can have one default changelog:
- Used on the company dashboard to show the latest changes
- Configurable via the "Set as default" action
- Database constraint ensures only one
is_default = trueper company
Audit Trail
All operations are recorded in the audit log:
- Tracked entities: changelog, changelog type, entry
- Actions: create, update, delete, archive, restore
- Context: user, before/after values, metadata