Company Dashboard
When you select a company in SmartDoc, the dashboard switches to display data specific to that client. This focused dashboard allows you to quickly assess the documentation status, expiration alerts, and recent activity for a single client.
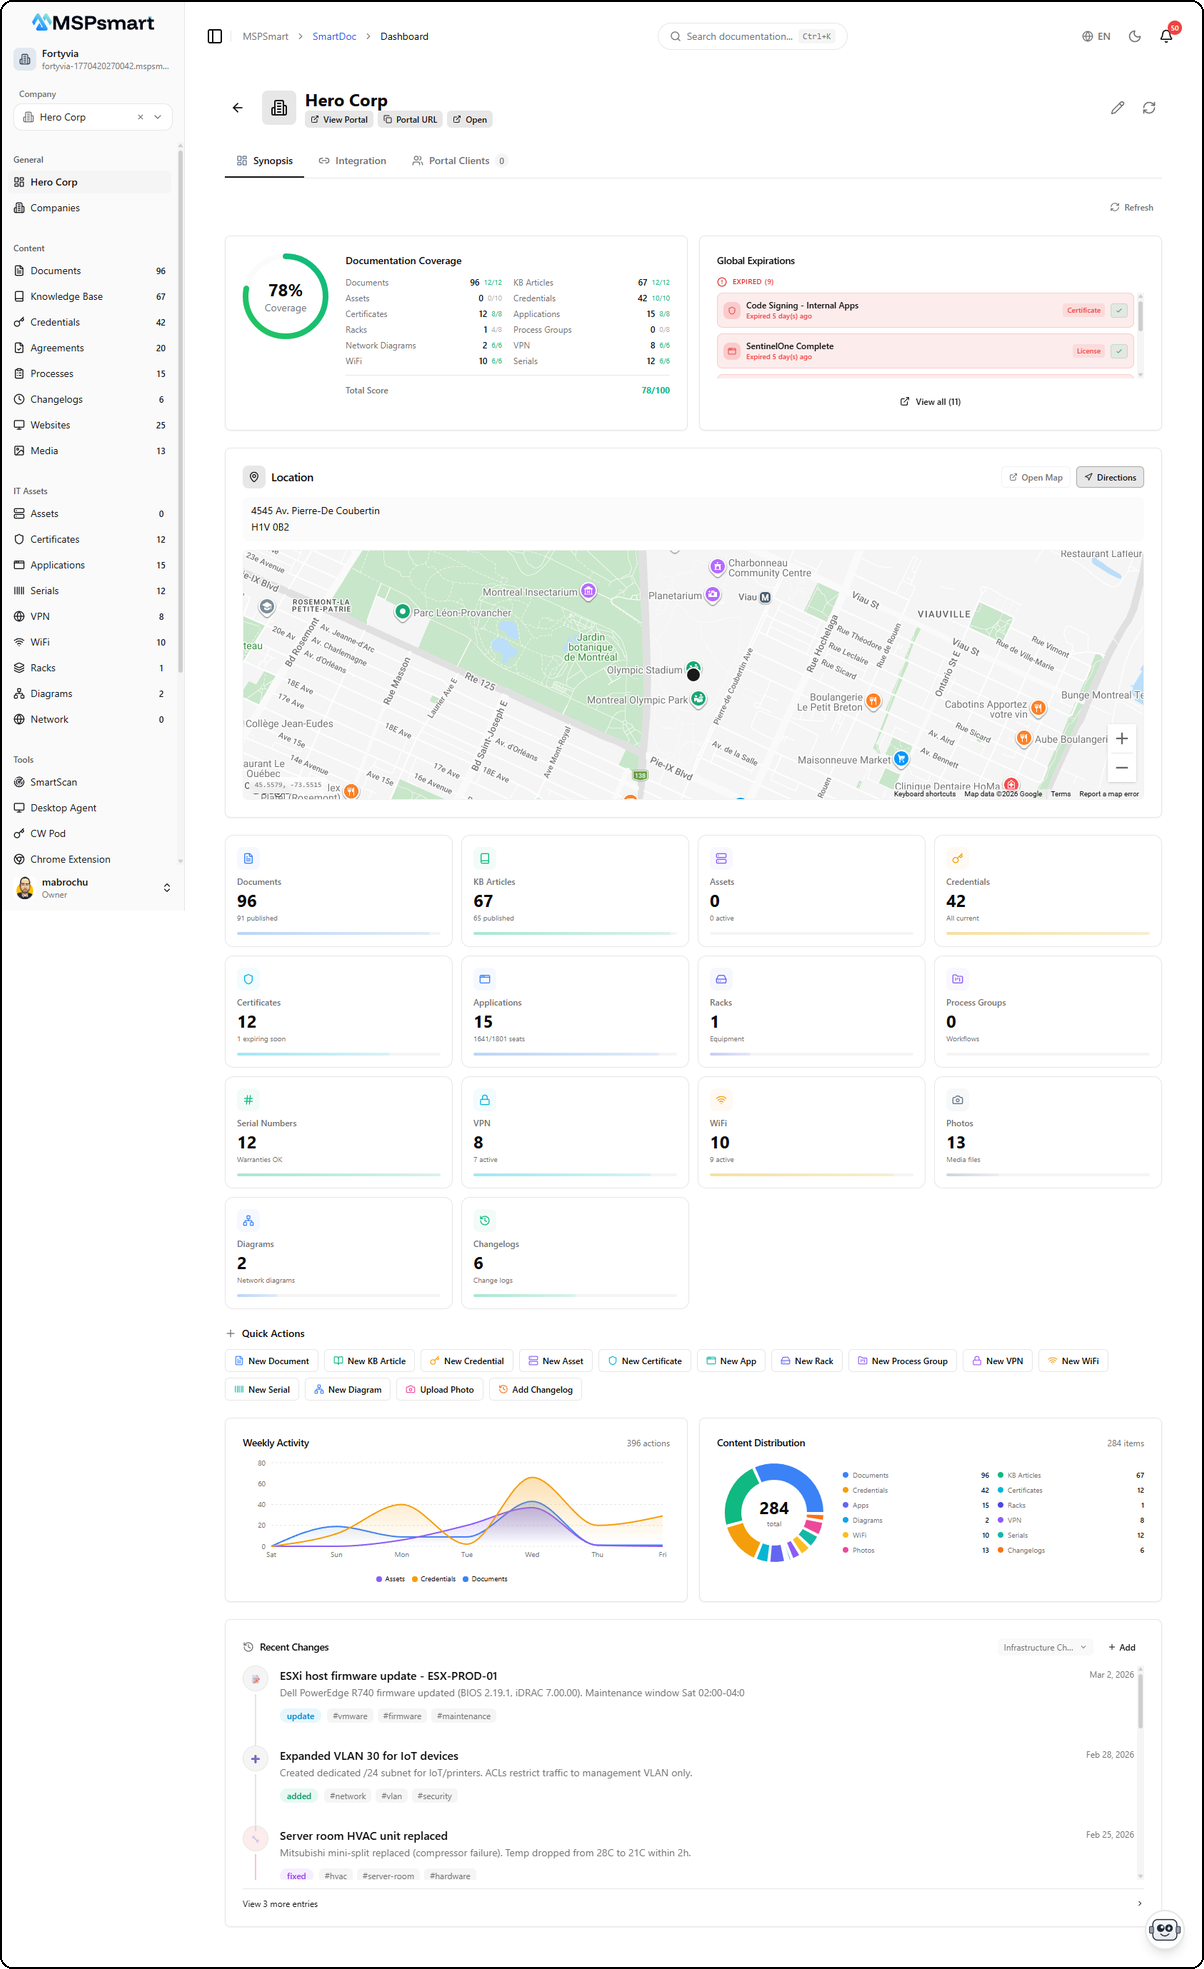
Company Header
The header displays the company name, its logo (or default icon), and quick access buttons to the client portal:

- View Portal — Opens the client portal in a new tab
- Portal URL — Copies the portal URL to clipboard
- Open — Opens the portal directly
The header also provides access to the three main tabs: Synopsis, Integration, and Portal Clients.
Synopsis Tab
The Synopsis tab is the default view. It displays all metrics, charts, and documentation information for the selected client.
Documentation Coverage
The coverage score is a circular visual indicator (0-100%) that evaluates the documentation completeness for the selected client. It is automatically calculated from 12 weighted categories.
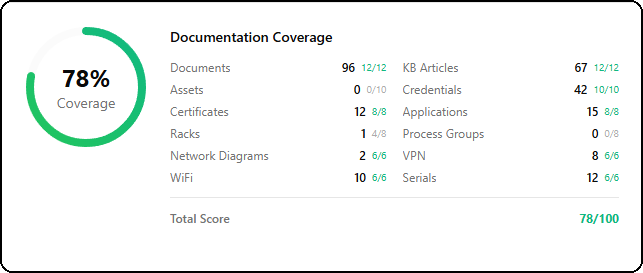
Each category displays three pieces of information: the item count, the earned score, and the maximum score. For example, "Documents 96 12/12" means 96 documents for a score of 12 out of 12 possible points.
Calculation Algorithm
| Category | Max Weight | Rule |
|---|---|---|
| Documents | 12 pts | 3 pts per document (max at 4+) |
| KB Articles | 12 pts | 3 pts per article (max at 4+) |
| Assets | 10 pts | 2 pts per asset (max at 5+) |
| Credentials | 10 pts | 2 pts per credential (max at 5+) |
| Certificates | 8 pts | 2 pts per certificate (max at 4+) |
| Applications | 8 pts | 2 pts per application (max at 4+) |
| Racks | 8 pts | 4 pts per rack (max at 2+) |
| Process Groups | 8 pts | 4 pts per group (max at 2+) |
| Network Diagrams | 6 pts | 3 pts per diagram (max at 2+) |
| VPN | 6 pts | 2 pts per VPN (max at 3+) |
| WiFi | 6 pts | 2 pts per WiFi (max at 3+) |
| Serial Numbers | 6 pts | 1 pt per serial (max at 6+) |
Maximum total: 100 points
Score color coding:
- Green (70%+) — Good documentation coverage
- Amber (40-69%) — Partial coverage, improvements needed
- Red (< 40%) — Insufficient coverage, action required
This score helps you quickly identify under-documented clients and prioritize your efforts.
Alerts and Expirations
The alerts panel displays expiring and expired items for the selected client. Items are shown with color coding and a badge indicating their type (Certificate, License, Password, Warranty).
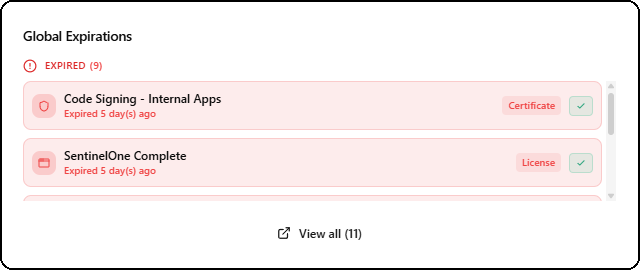
Each item displays:
- The name of the item (e.g., "Code Signing - Internal Apps")
- The number of days since expiration or before expiration
- A colored type badge (Certificate, License, Password, Warranty)
- A checkbox to acknowledge the item
Items are grouped into two categories:
- Expired — Items past their expiration date (red background)
- Expiring Soon — Items expiring within the next 90 days (amber background)
The View all link at the bottom shows the complete list of expirations for this client.
Like the Global Dashboard, the acknowledgment system allows marking items as handled with optional notes.
Location Map
If the company has a configured address, an interactive map displays the geographic location of the client. The map includes the full address above and two action buttons:
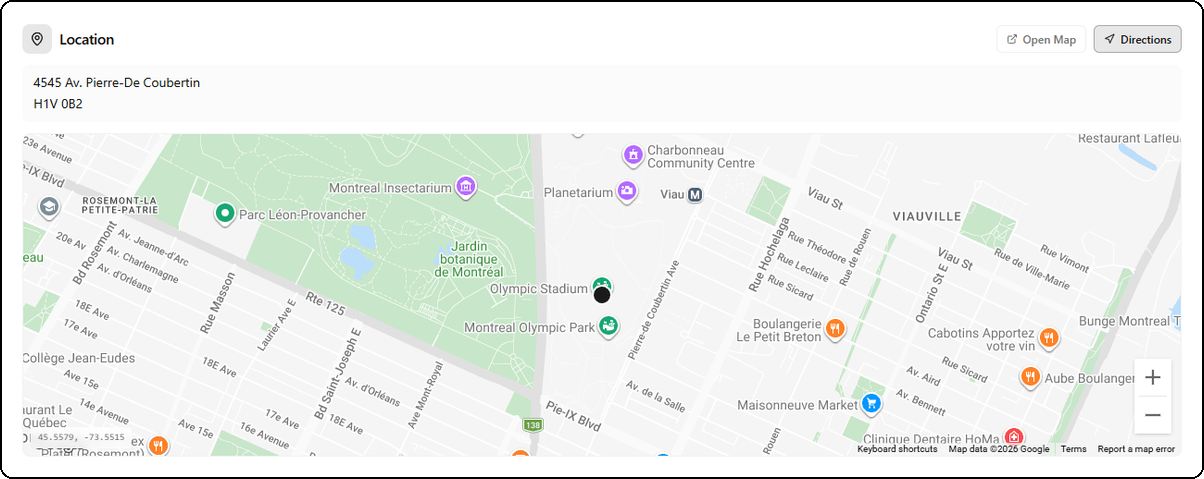
- Open Map — Opens the location in Google Maps
- Directions — Launches directions to the client in Google Maps
This feature is useful for MSPs managing geographically dispersed clients.
Metrics Grid
A grid of 14 clickable tiles displays detailed counters for each content category for the client. Each tile has a colored icon, a main counter, and a contextual sub-detail.
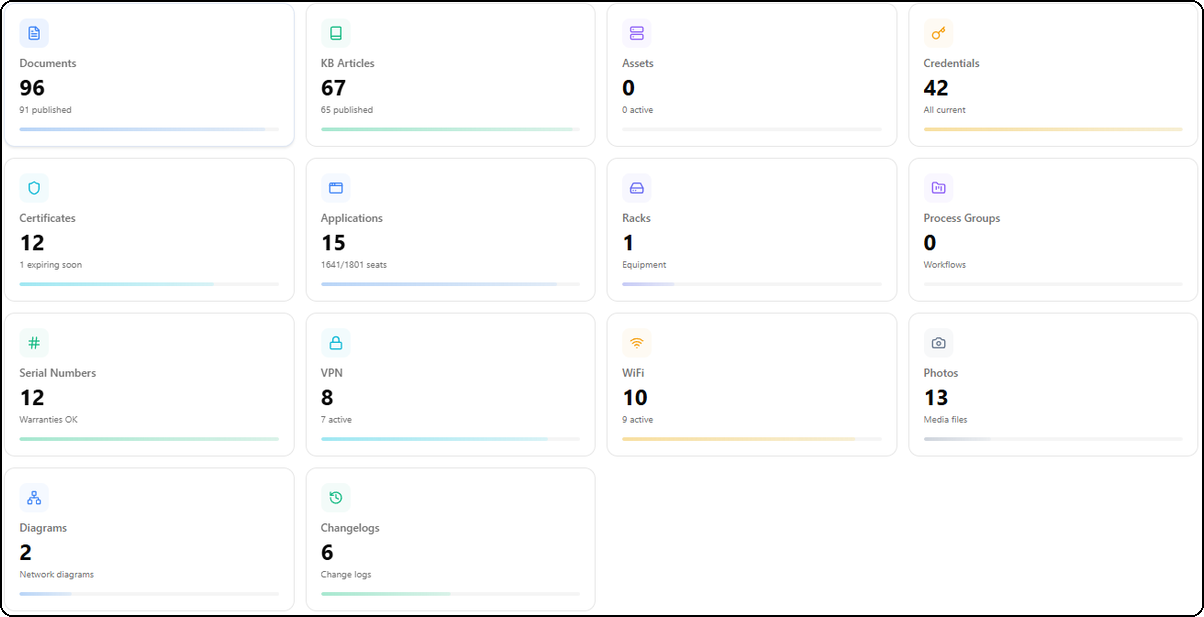
| Category | Icon | Sub-detail |
|---|---|---|
| Documents | Blue | Published count (e.g., "91 published") |
| KB Articles | Green | Published count (e.g., "65 published") |
| Assets | Purple | Active count (e.g., "0 active") |
| Credentials | Orange | Expiration status (e.g., "All current") |
| Certificates | Cyan | Expiring soon count (e.g., "1 expiring soon") |
| Applications | Blue | Seats used/total (e.g., "1641/1801 seats") |
| Racks | Indigo | Equipment type (e.g., "Equipment") |
| Process Groups | Pink | Workflow count |
| Serial Numbers | Dark green | Warranty status (e.g., "Warranties OK") |
| VPN | Blue | Active count (e.g., "7 active") |
| WiFi | Orange | Active count (e.g., "9 active") |
| Photos | Purple | Media file count |
| Diagrams | Gray | Network diagram count |
| Changelogs | Teal | Change log count |
Each tile includes a colored progress bar at the bottom. Clicking a tile navigates directly to the corresponding section, filtered for the selected client.
Quick Actions
The quick action bar allows you to create content directly within the context of the selected client. Items created will be automatically associated with this client.

14 buttons with icons allow you to quickly create:
| Action | Description |
|---|---|
| New Document | Create a new document |
| New KB Article | Create a knowledge base article |
| New Credential | Add a credential to the vault |
| New Asset | Register a new IT asset |
| New Certificate | Add an SSL/TLS certificate |
| New App | Register an application/license |
| New Rack | Create an equipment rack |
| New Process Group | Create a process group |
| New VPN | Add a VPN configuration |
| New WiFi | Add a WiFi configuration |
| New Serial | Register a serial number |
| New Diagram | Create a network diagram |
| Upload Photo | Upload a photo/media |
| Add Changelog | Add a changelog entry |
Weekly Activity
Area chart over 7 days showing documentation activity for this specific client. The chart displays the total action count for the period in the top right corner.
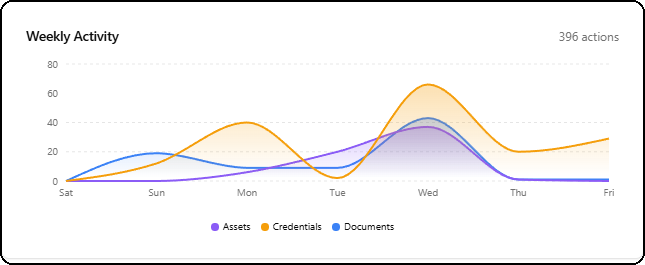
Three colored curves segment activity by content type:
- Purple — Assets
- Orange — Credentials
- Blue — Documents
Hovering over a day displays a detailed tooltip with per-category counts. This chart helps identify the most active days and documentation trends for this client.
Content Distribution
Donut chart showing the proportional distribution of content for this client only. The center of the chart displays the total item count.
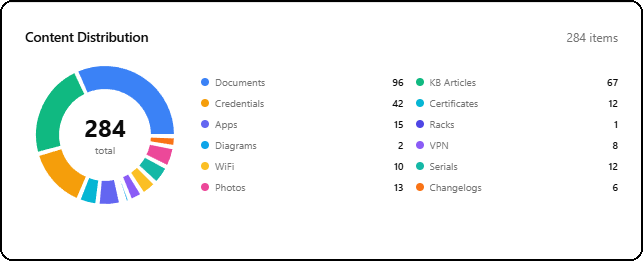
Each segment is uniquely colored with a legend and counter: Documents, KB Articles, Credentials, Certificates, Applications, Racks, Diagrams, VPN, WiFi, Serials, Photos, Changelogs.
This chart allows you to quickly see which categories are well-documented and which need attention.
Recent Changes
The recent changes timeline is exclusive to the Company Dashboard. It displays the chronological history of all infrastructure changes for this client.
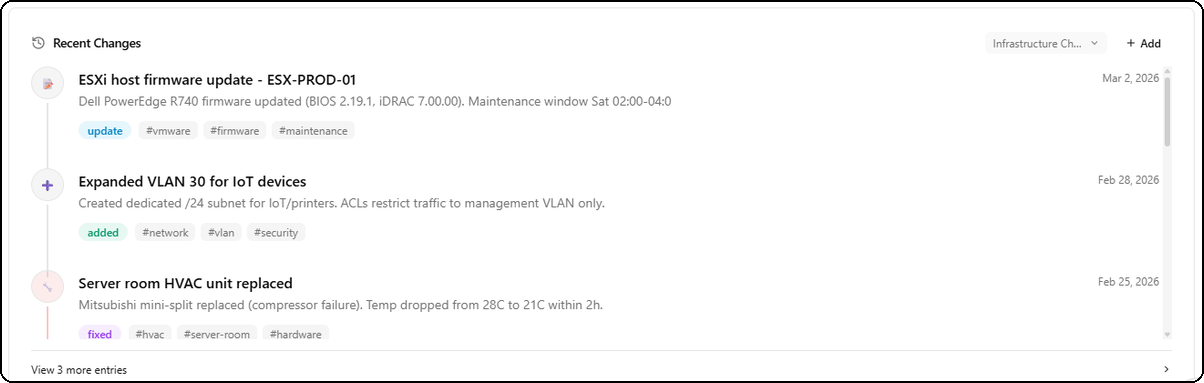
Each entry displays:
- A colored icon based on the change type (update in purple, addition in green, fix in blue)
- The title of the change (e.g., "ESXi host firmware update - ESX-PROD-01")
- A detailed description of the modification performed
- The date of the change
- Type tags (update, added, fixed) with color coding
- Category hashtags (#vmware, #firmware, #network, #security, etc.)
In the top right, a changelog selector dropdown lets you choose among different changelogs if the client has multiple. The + Add button allows adding a new entry directly.
The View X more entries link at the bottom provides access to the complete history.
This feature is essential for tracking infrastructure changes and compliance with ITIL best practices.
Integration Tab
The Integration tab allows you to connect the client to third-party documentation platforms to synchronize data.
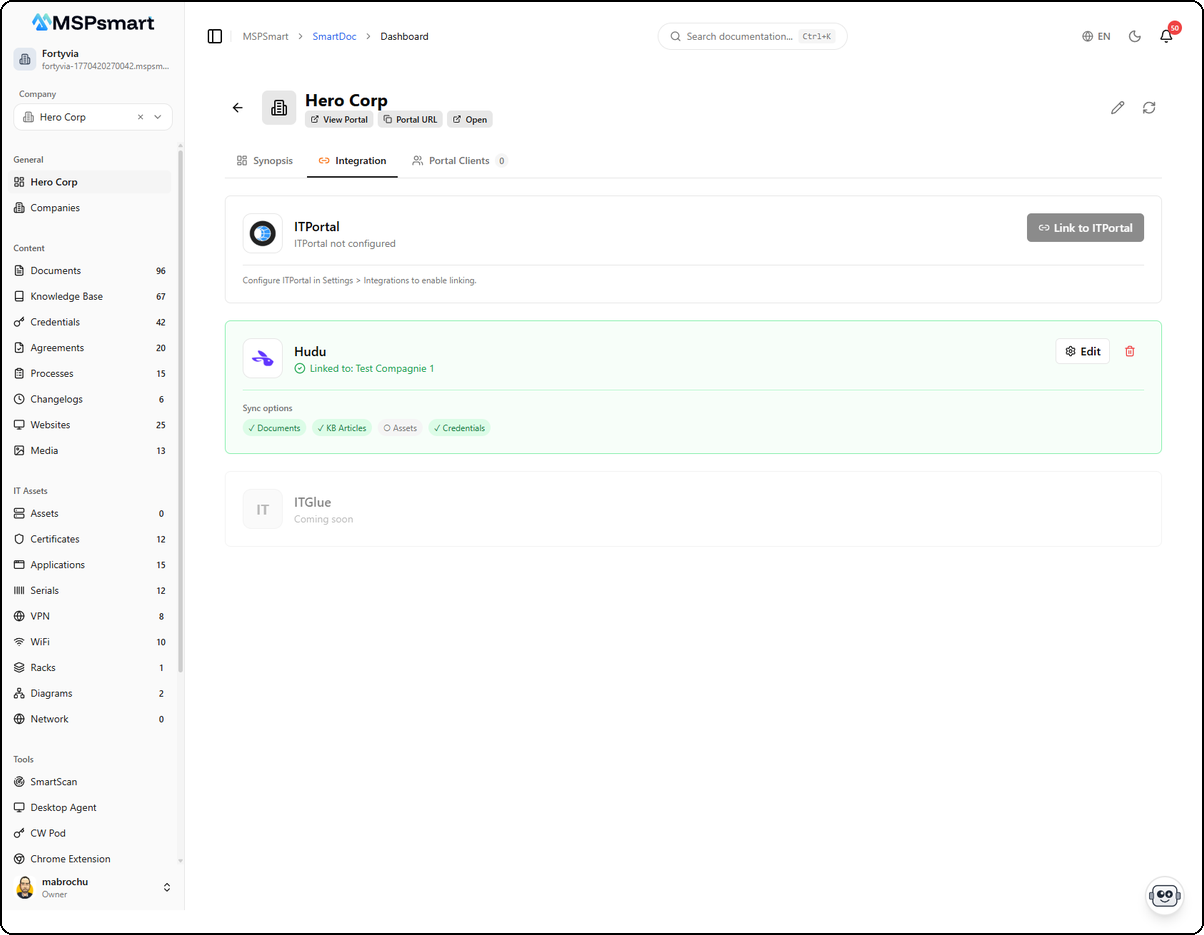
Three integrations are available:
ITPortal
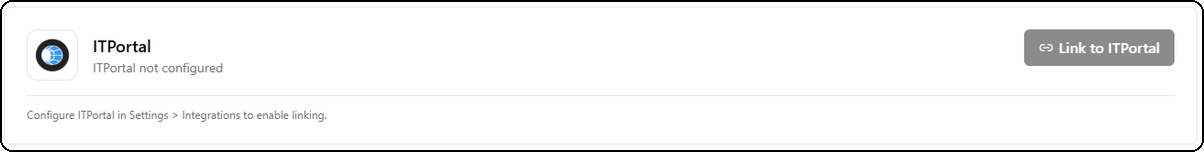
The ITPortal card displays the connection status with the IT Portal platform. If ITPortal is not configured, a message indicates "ITPortal not configured" with a link to Settings > Integrations to enable linking. The Link to ITPortal button allows you to directly link the client to its equivalent in IT Portal.
Hudu
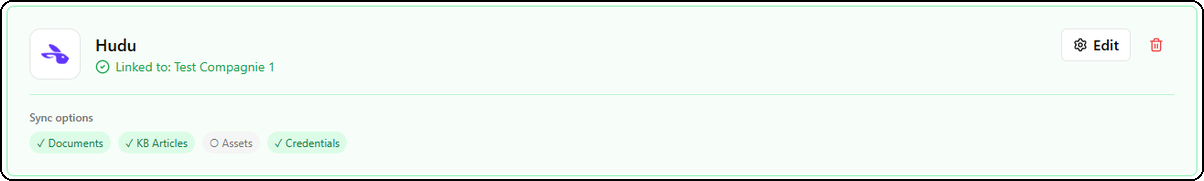
The Hudu card displays the linking status with Hudu. When the link is active, it shows the linked company name (e.g., "Linked to: Test Compagnie 1") with a green background.
The Sync options section displays the synced content categories with badges:
- Documents — Document synchronization
- KB Articles — KB article synchronization
- Assets — Asset synchronization (can be disabled)
- Credentials — Credential synchronization
The Edit and delete (trash icon) buttons allow modifying or removing the link.
Edit Hudu Link
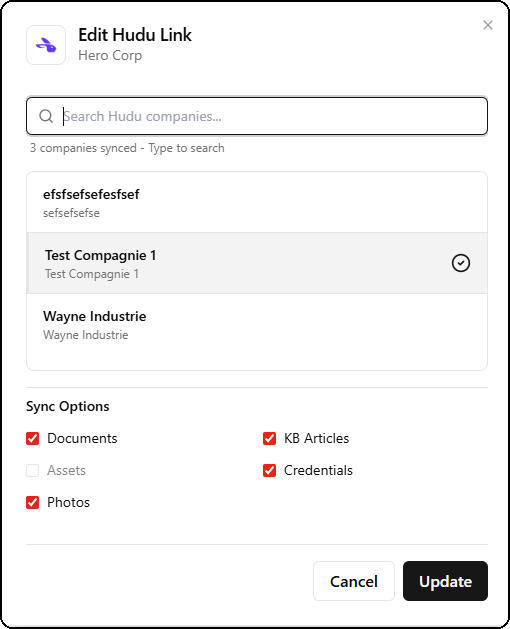
The edit dialog allows you to:
- Search among available Hudu companies
- Select the company to link (indicated by a green checkmark)
- Configure sync options by checking/unchecking: Documents, KB Articles, Assets, Credentials, Photos
- Update or Cancel the changes
ITGlue
The ITGlue card displays "Coming soon", indicating this integration will be available in a future release.
Portal Clients Tab
The Portal Clients tab manages contacts who have access to this company's client portal.
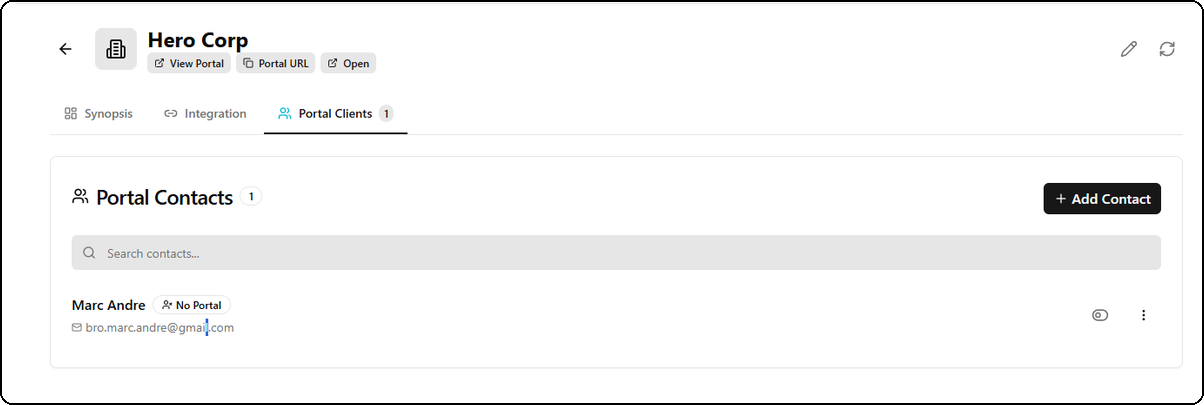
The tab displays:
- The total contact count in a badge (e.g., "1")
- A search bar to filter contacts
- The contact list with for each:
- Full name
- Portal status badge ("No Portal" in gray if not activated)
- Email address
- Action buttons (view profile, context menu)
The + Add Contact button in the top right allows adding a new contact.
Add a Contact
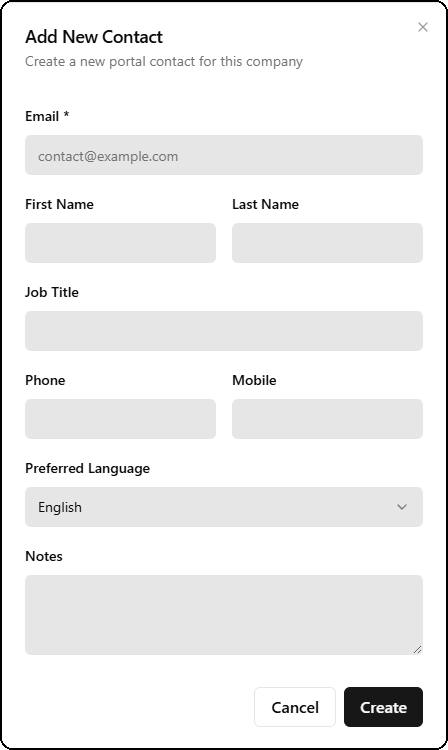
The add contact form includes the following fields:
| Field | Required | Description |
|---|---|---|
| Yes | Contact email address | |
| First Name | No | First name |
| Last Name | No | Last name |
| Job Title | No | Job title |
| Phone | No | Landline phone |
| Mobile | No | Mobile phone |
| Preferred Language | No | Preferred language (English/French) |
| Notes | No | Additional notes |
Once created, the contact appears in the list and can be invited to access the client portal.
Differences from the Global Dashboard
| Feature | Global Dashboard | Company Dashboard |
|---|---|---|
| Scope | All clients | Single client |
| Coverage score | Documentation health (6 metrics) | Coverage score (12 weighted categories) |
| Location map | No | Yes |
| Leaderboard | Yes | No |
| Changelog timeline | No | Yes |
| Quick actions | 12 creation buttons | 14 client-contextual buttons |
| Expirations | All clients combined | Selected client only |
| Integration tab | No | Yes (ITPortal, Hudu, ITGlue) |
| Portal Clients tab | No | Yes (portal contact management) |