Global Dashboard
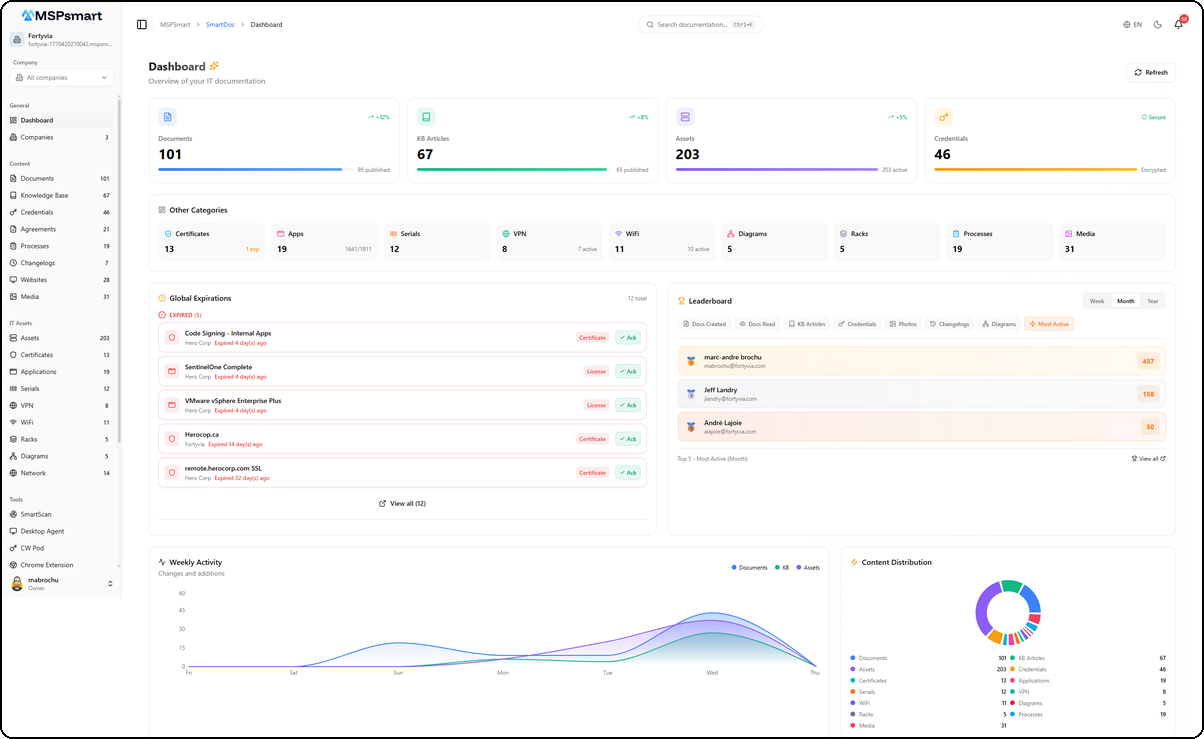
The dashboard is SmartDoc's home page. It provides a complete overview of all your IT documentation with real-time statistics, activity charts, expiration tracking, and a documentation health assessment.
Main Statistics Cards
Four cards display real-time key metrics with trend indicators:
| Card | Data | Indicator |
|---|---|---|
| Documents | Total, published count | Progress bar for publication rate |
| KB Articles | Total, published articles | Progress bar for publication rate |
| Assets | Total IT assets | Progress bar for active assets |
| Credentials | Vault total | Alert if passwords expiring soon, otherwise "Secure" badge |
Each card includes a visual progress bar and a trend badge (+12%, +8%, etc.).
Secondary Categories
A grid of 9 additional counters provides a quick overview of all other content categories. Each tile is clickable and navigates to the corresponding section.
| Category | Displayed Details |
|---|---|
| Certificates | Total + expiring soon count |
| Applications | Total + seats used/total |
| Serial Numbers | Total + warranties expiring soon |
| VPN | Total + active count |
| WiFi | Total + active count |
| Network Diagrams | Total |
| Racks | Total |
| Processes | Total |
| Photos/Media | Total |
Expiring Items (Global Expiring)
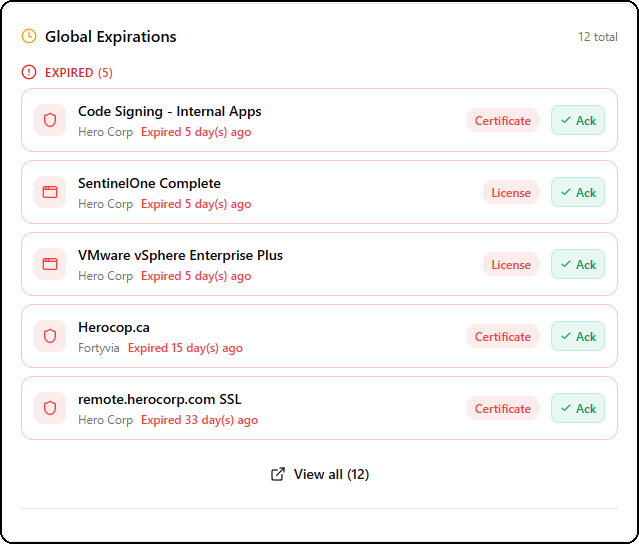
This section centralizes all items approaching their expiration date across all your clients. It groups four types of items:
- Passwords — Credentials with upcoming expiration dates
- SSL/TLS Certificates — Certificates approaching expiry
- Application Licenses — Software licenses due for renewal
- Warranties — Serial numbers with expiring warranties
Each item displays:
- Name and type (color-coded icon)
- Associated client name
- Days remaining until expiration (color-coded: red if < 7 days, amber if < 30 days)
Acknowledgment System
The acknowledgment system allows you to mark an expiring item as "handled" to reduce noise on the dashboard:
- Click on an expiring item
- Add an optional note (e.g., "Renewal ordered on March 15")
- The item is marked as acknowledged with the user's name and date
Acknowledged items are hidden by default but remain accessible via a toggle button. You can undo an acknowledgment at any time.
Contributor Leaderboard
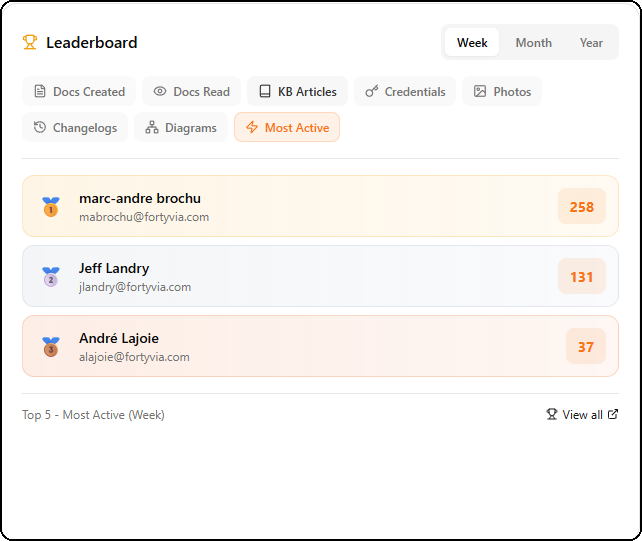
The leaderboard highlights the most active users in documentation. It encourages team engagement by gamifying contributions.
Available Periods
Period selector: Week, Month, Year.
Leaderboard Categories
| Category | Description |
|---|---|
| Most Active | Overall activity score across all categories |
| Docs Created | Number of documents created |
| Docs Read | Number of documents viewed |
| KB Articles | Number of KB articles created |
| Credentials | Number of credentials added |
| Photos | Number of photos uploaded |
| Changelogs | Number of changelog entries |
| Diagrams | Number of network diagrams created |
The top three in each category receive medals (gold, silver, bronze). Click on a user to view their profile.
Weekly Activity
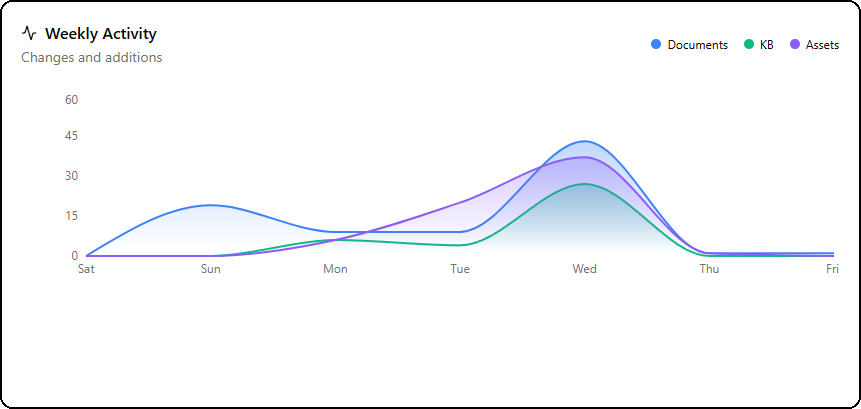
Area chart over 7 days showing documentation activity trends, segmented by content type:
- Blue — Documents
- Green — KB Articles
- Purple — Assets
Hovering over a day displays a detailed tooltip with per-category counts. This chart helps identify the most active days and documentation trends within your team.
Content Distribution
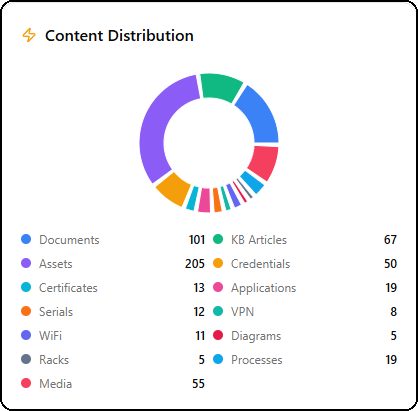
Donut chart showing the proportional distribution of your 13 content categories:
Documents, KB Articles, Assets, Credentials, Certificates, Applications, Serial Numbers, VPN, WiFi, Diagrams, Racks, Processes, Photos.
Each segment is uniquely colored with a legend and counter. Categories with 0 items are automatically hidden. This chart helps you quickly identify imbalances in your documentation.
Quick Actions
12 color-coded buttons allow you to create content in a single click from the dashboard:
| Action | Color | Destination |
|---|---|---|
| Document | Blue | Document editor |
| KB Article | Green | KB article editor |
| Asset | Purple | Asset form |
| Credential | Amber | Credential form |
| Certificate | Cyan | Certificate form |
| Application | Pink | Application form |
| Serial Number | Orange | Serial number form |
| VPN | Teal | VPN form |
| WiFi | Indigo | WiFi form |
| Rack | Slate | Rack editor (new tab) |
| Process | Sky | Process form |
| Network Diagram | Rose | Network diagram editor |
Recent Activity
The 8 latest actions performed on the platform with:
-
Color-coded badge by action type:
- Green: creation
- Blue: update
- Gray: view
- Red: deletion
- Indigo: share
- Amber: copy/reveal
- Teal: restore
- Purple: publish
-
User who performed the action
-
Description with entity type (document, asset, credential, etc.)
-
Direct link to the related resource
-
Change details (expandable before/after)
-
Relative timestamp (5 minutes ago, yesterday, etc.)
Documentation Health (Doc Health)
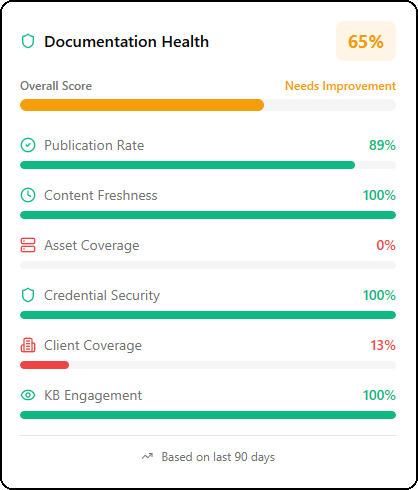
The documentation health widget calculates an overall score and six individual metrics to evaluate the quality and completeness of your documentation:
Overall Score
A global percentage with color coding:
- Green (70%+) — Documentation is healthy
- Amber (40-69%) — Improvements needed
- Red (< 40%) — Attention required
Detailed Metrics
| Metric | Description | Calculation |
|---|---|---|
| Publication Rate | Proportion of published vs draft content | Published documents and articles / total |
| Content Freshness | Recently updated vs stale content | Documents modified in the last 90 days |
| Asset Coverage | Properly documented assets | Assets with description and details / total |
| Credential Security | Valid vs expired credentials | Non-expired credentials / total (alert if expired > 0) |
| Client Coverage | Clients with documentation | Clients with at least 1 document / total clients |
| KB Engagement | Knowledge base usage | Average views per article (normalized: 10+ views = 100%) |
Each metric displays a color-coded progress bar and a text detail (e.g., "45/60 documented").