Websites
The Websites module allows you to monitor and document all your clients' websites. It provides automatic monitoring with HTTP, SSL, domain, DNS, and email security checks, all in a unified interface with configurable alerts.
Website List
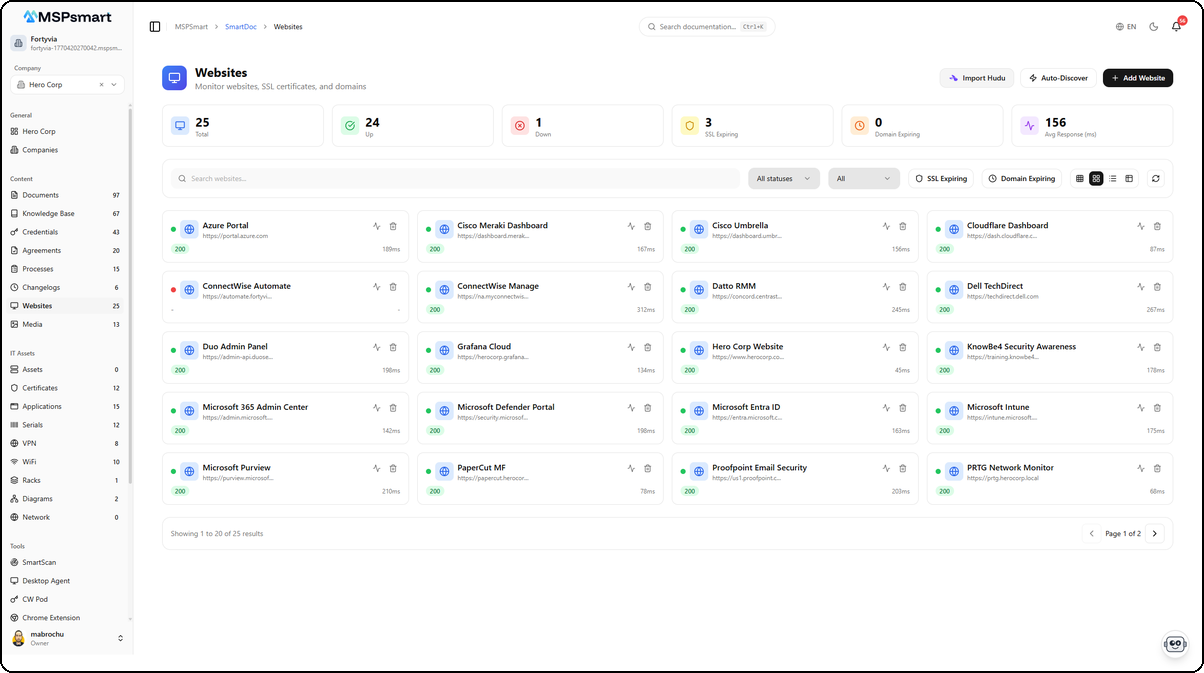
The main page displays all websites as cards or in a table. Each site shows its name, URL, HTTP response code (colored badge), response time, and an availability indicator (green dot = online, red = offline).
Statistics
At the top of the page, statistics cards provide a quick overview:
- Total — Total number of monitored websites
- Up — Sites responding correctly (online)
- Down — Sites not responding or in error
- SSL Expiring — SSL certificates expiring within the next 30 days
- Domain Expiring — Domains expiring within the next 30 days
- Avg Response (ms) — Average response time in milliseconds
Filters
- Search by name or URL in real time
- All statuses: Active, Inactive, Archived
- All (Up/Down): filter by availability state
- SSL Expiring: show only sites with SSL expiring soon
- Domain Expiring: show only sites with domain expiring soon
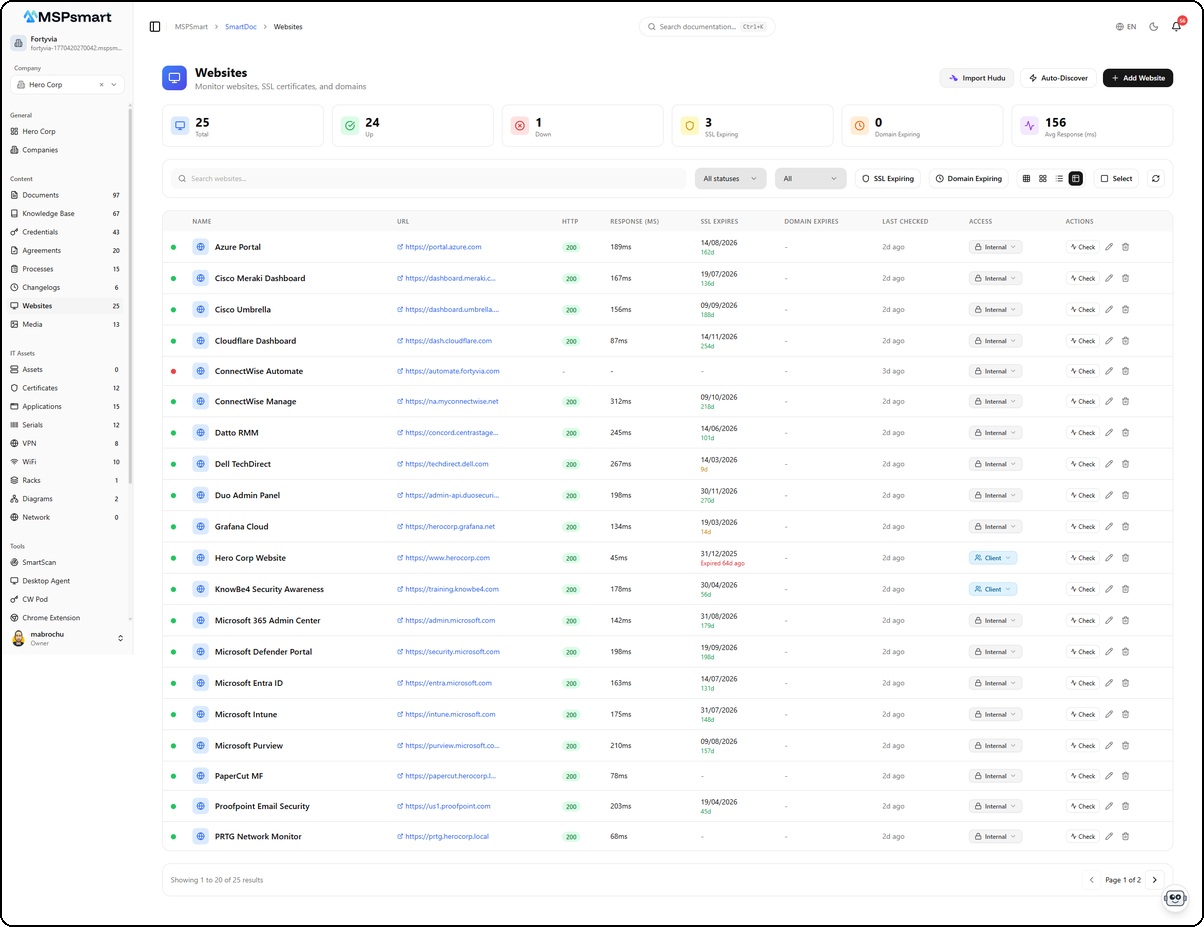
Table View
The table view provides a detailed display with the following columns:
| Column | Description |
|---|---|
| Name | Website name with availability indicator (colored dot) |
| URL | Clickable URL with external link |
| HTTP | HTTP response code (200, 301, 404, 500...) with colored badge |
| Response (ms) | Response time in milliseconds |
| SSL Expires | SSL certificate expiration date with colored countdown |
| Domain Expires | Domain expiration date |
| Last Checked | Date of last check (relative time) |
| Access | Access level (Internal, Client) with editable dropdown |
| Actions | Check, Edit, Delete for each site |
SSL expiration dates use a color code: green (> 30 days), yellow (8-30 days), red (< 7 days or expired). Already expired certificates display "Expired" in red.
Display Modes
| Mode | Description |
|---|---|
| Grid | Compact card view with HTTP status and response time |
| Detailed Grid | Cards with additional information |
| List | Condensed list view |
| Table | Full table view with all columns |
Toolbar Actions
- Import Hudu — Import websites from Hudu
- Auto-Discover — Automatically discover client websites
- + Add Website — Create a new website
- Select — Enable selection mode for bulk actions
- Refresh — Refresh the list and statuses
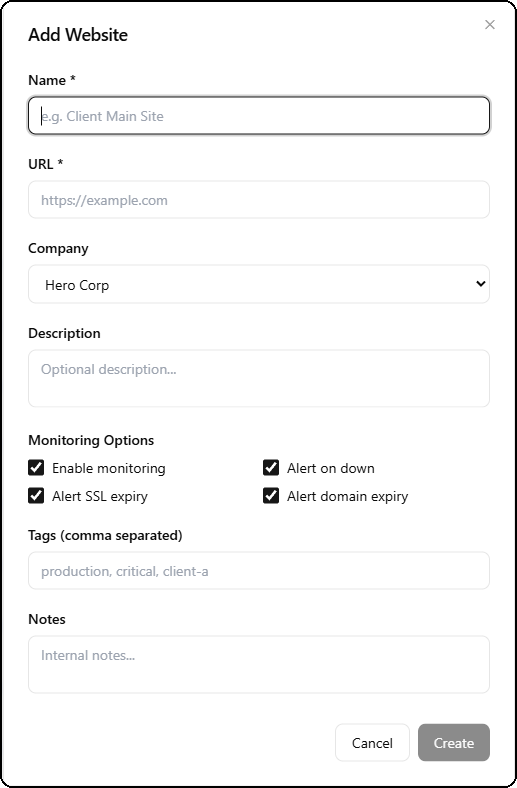
Create a Website
The + Add Website button opens a creation form in a side panel.
| Field | Required | Description |
|---|---|---|
| Name | Yes | Website name (e.g., Client Main Site) |
| URL | Yes | Full URL (e.g., https://example.com) |
| Company | No | Associated company (selected from list) |
| Description | No | Optional website description |
Monitoring Options
The creation form directly includes monitoring options:
| Option | Description |
|---|---|
| Enable monitoring | Enables automatic website monitoring |
| Alert on down | Sends a notification when the site goes down |
| Alert SSL expiry | Alerts before SSL certificate expiration |
| Alert domain expiry | Alerts before domain name expiration |
All these options are enabled by default to ensure comprehensive monitoring from creation.
| Field | Description |
|---|---|
| Tags | Comma-separated tags for organization (e.g., production, critical, client-a) |
| Notes | Internal notes about the site |
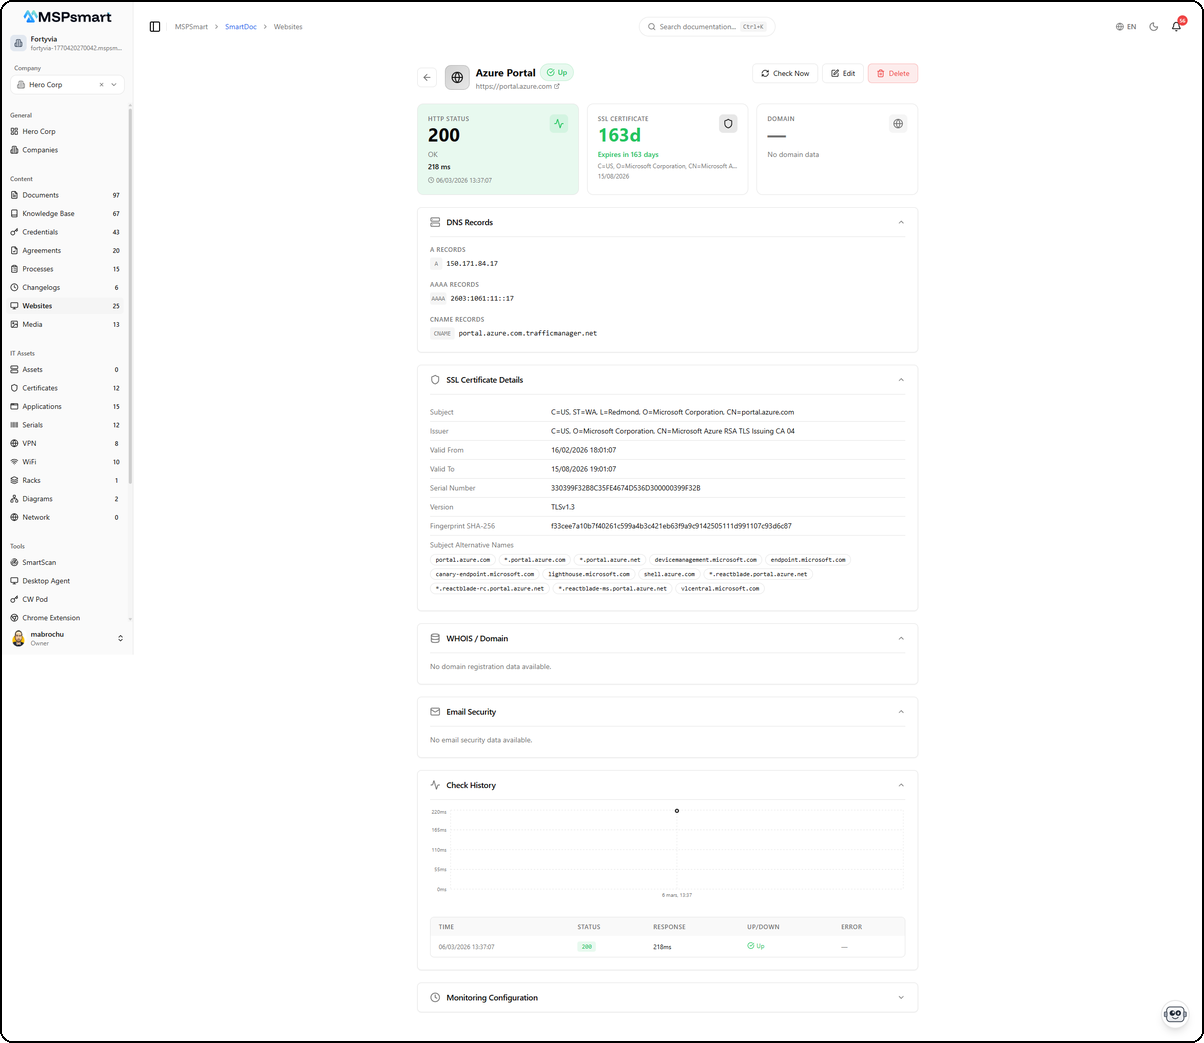
Website Detail
Clicking on a website opens its detail page with a header showing the name, Up/Down status, clickable URL, and three summary cards: HTTP Status, SSL Certificate, and Domain. Several collapsible sections present the complete data.
Header and Summary
The header displays:
- The website name with the availability badge (Up/Down)
- The URL with clickable external link
- Three action buttons: Check Now, Edit, and Delete
The three summary cards show:
- HTTP Status — HTTP code (200), status (OK), response time (218 ms), and last check date
- SSL Certificate — Days until expiration with colored countdown, issuer, and expiration date
- Domain — Domain expiration information (or "No domain data" if unavailable)
DNS Records
The DNS Records section displays automatically discovered records:
| Type | Description |
|---|---|
| A Records | IPv4 addresses (e.g., 150.171.84.17) |
| AAAA Records | IPv6 addresses (e.g., 2603:1061:11::17) |
| CNAME Records | Domain aliases (e.g., portal.azure.com.trafficmanager.net) |
| MX | Mail servers with priority |
| NS | Name servers |
| TXT | Text records (SPF, DKIM, etc.) |
| SOA | Start of Authority |
SSL Certificate Details
The SSL Certificate Details section contains full certificate information:
| Field | Description |
|---|---|
| Subject | Domain and organization covered by the certificate |
| Issuer | Certificate authority (e.g., Microsoft Azure RSA TLS Issuing CA 04) |
| Valid From | Validity start date |
| Valid To | Expiration date |
| Serial Number | Certificate serial number |
| Version | TLS version (e.g., TLSv1.3) |
| Fingerprint SHA-256 | Cryptographic fingerprint of the certificate |
| Subject Alternative Names | List of all domains covered by the certificate |
WHOIS / Domain
Domain registration information including registrar, creation, update, and expiration dates, as well as raw WHOIS data (collapsible).
Email Security
Analysis of the domain's email security configuration:
| Field | Description |
|---|---|
| SPF | SPF record with validation (valid/invalid) |
| DMARC | DMARC record with policy (none, quarantine, reject) |
| DKIM | DKIM record |
| Security Score | Overall email security score |
Check History
The Check History section displays:
- An area chart showing the response time evolution
- A detailed table of each check with columns: Time, Status (HTTP badge), Response (ms), Up/Down, and Error
Monitoring
Configuration
The Edit button on the detail page opens a monitoring configuration dialog.
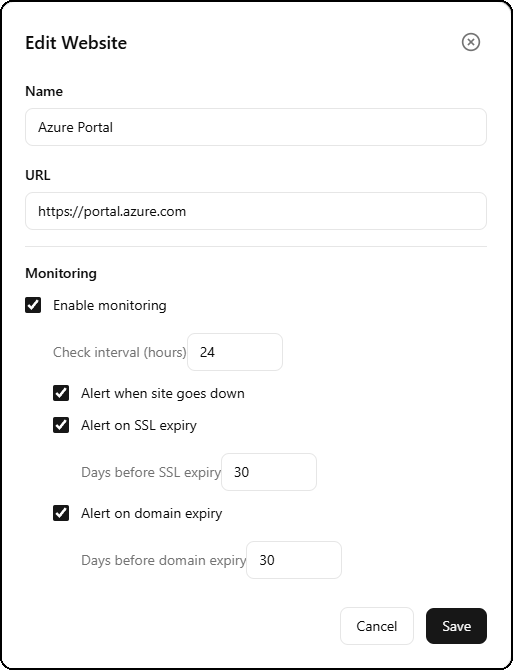
| Option | Description | Default |
|---|---|---|
| Enable monitoring | Enable/disable automatic checks | Enabled |
| Check interval (hours) | Check frequency in hours (1 to 24) | 24 hours |
| Alert when site goes down | Notification when site goes down | Enabled |
| Alert on SSL expiry | Notification before SSL certificate expiration | Enabled |
| Days before SSL expiry | Number of days before SSL alert | 30 days |
| Alert on domain expiry | Notification before domain expiration | Enabled |
| Days before domain expiry | Number of days before domain alert | 30 days |
Checks Performed
Each check automatically verifies:
- HTTP — Response code, response time, availability
- SSL — Certificate validity, dates, issuer, SAN
- DNS — A, AAAA, MX, NS, TXT, SOA, CNAME records
- Domain — WHOIS, registrar, expiration dates
- Email Security — SPF, DMARC, DKIM, security score
Check Now
The Check Now button triggers an immediate site check, refreshing all information (HTTP, SSL, DNS, domain, email).
Auto-Discovery
SmartDoc can auto-discover your clients' websites by scanning URLs associated with companies (company website, client portal, etc.). Click the Auto-Discover button in the toolbar to launch the scan.
Hudu Import
If the Hudu integration is configured, the Import Hudu button allows importing websites from Hudu with automatic company matching.
Bulk Actions
In selection mode (Select button), the following actions are available on multiple sites simultaneously:
- Change Access Level — Internal, Client, or Public
- Change Status — Active, Inactive, Archived
- Delete — Deletion with confirmation
Access Levels
| Level | Admin Portal | Client Portal | Public |
|---|---|---|---|
| Internal | Yes | No | No |
| Client | Yes | Yes | No |
| Public | Yes | Yes | Yes |
The access level can be changed directly from the table view via the dropdown in the Access column.
Color Indicators
SSL / Domain Expiration
The expiration day counters use a color code:
- Green — More than 30 days remaining
- Yellow — Between 8 and 30 days remaining
- Red — 7 days or less, or already expired (displays "Expired")
HTTP Code
- Green (2xx) — Success
- Blue (3xx) — Redirect
- Yellow (4xx) — Client error
- Red (5xx) — Server error